Case study · 03 Enterprise UX Toyota · Deloitte Data viz · Decision support Case study · 03 Enterprise UX Toyota · Deloitte Data viz · Decision support
Case Study · No. 03
Enterprise UX · Data viz & decision support
Toyota · Deloitte · Strategic platforms

Decisions, made visible.

Two enterprise UX projects for two very different beasts. Toyota needed an executive impact-assessment platform — upload baseline data, adjust parameters, compare scenarios. Deloitte's tax-strategy team needed a platform that could replace PowerPoint and Excel mid-client-meeting. Both came down to making complex data feel decisive.

Built for Toyota Deloitte
01 — The short version

What enterprise UX actually demands.

Both projects had the same shape: experts drowning in tools. PowerPoint, Excel, multiple BI systems. The brief in each case was to consolidate — and to make the result feel like decision-making, not data entry.

Toyota — A custom impact-assessment platform for executives. Upload baseline data manually, adjust parameters dynamically, compare portfolios side-by-side. Built in collaboration with Kaizen Analytix.

Deloitte — An internal web platform for the VCA (Value Chain Analysis) Sales Team. Streamlined tax strategy creation and presentation, with real-time adaptability during client meetings.

For both, the work was research-led: workshops, personas, terminology decoding, iteration. The screens are downstream of the thinking.

02 — Project 01
Client Toyota

Toyota Insights — a classic, designed for today.

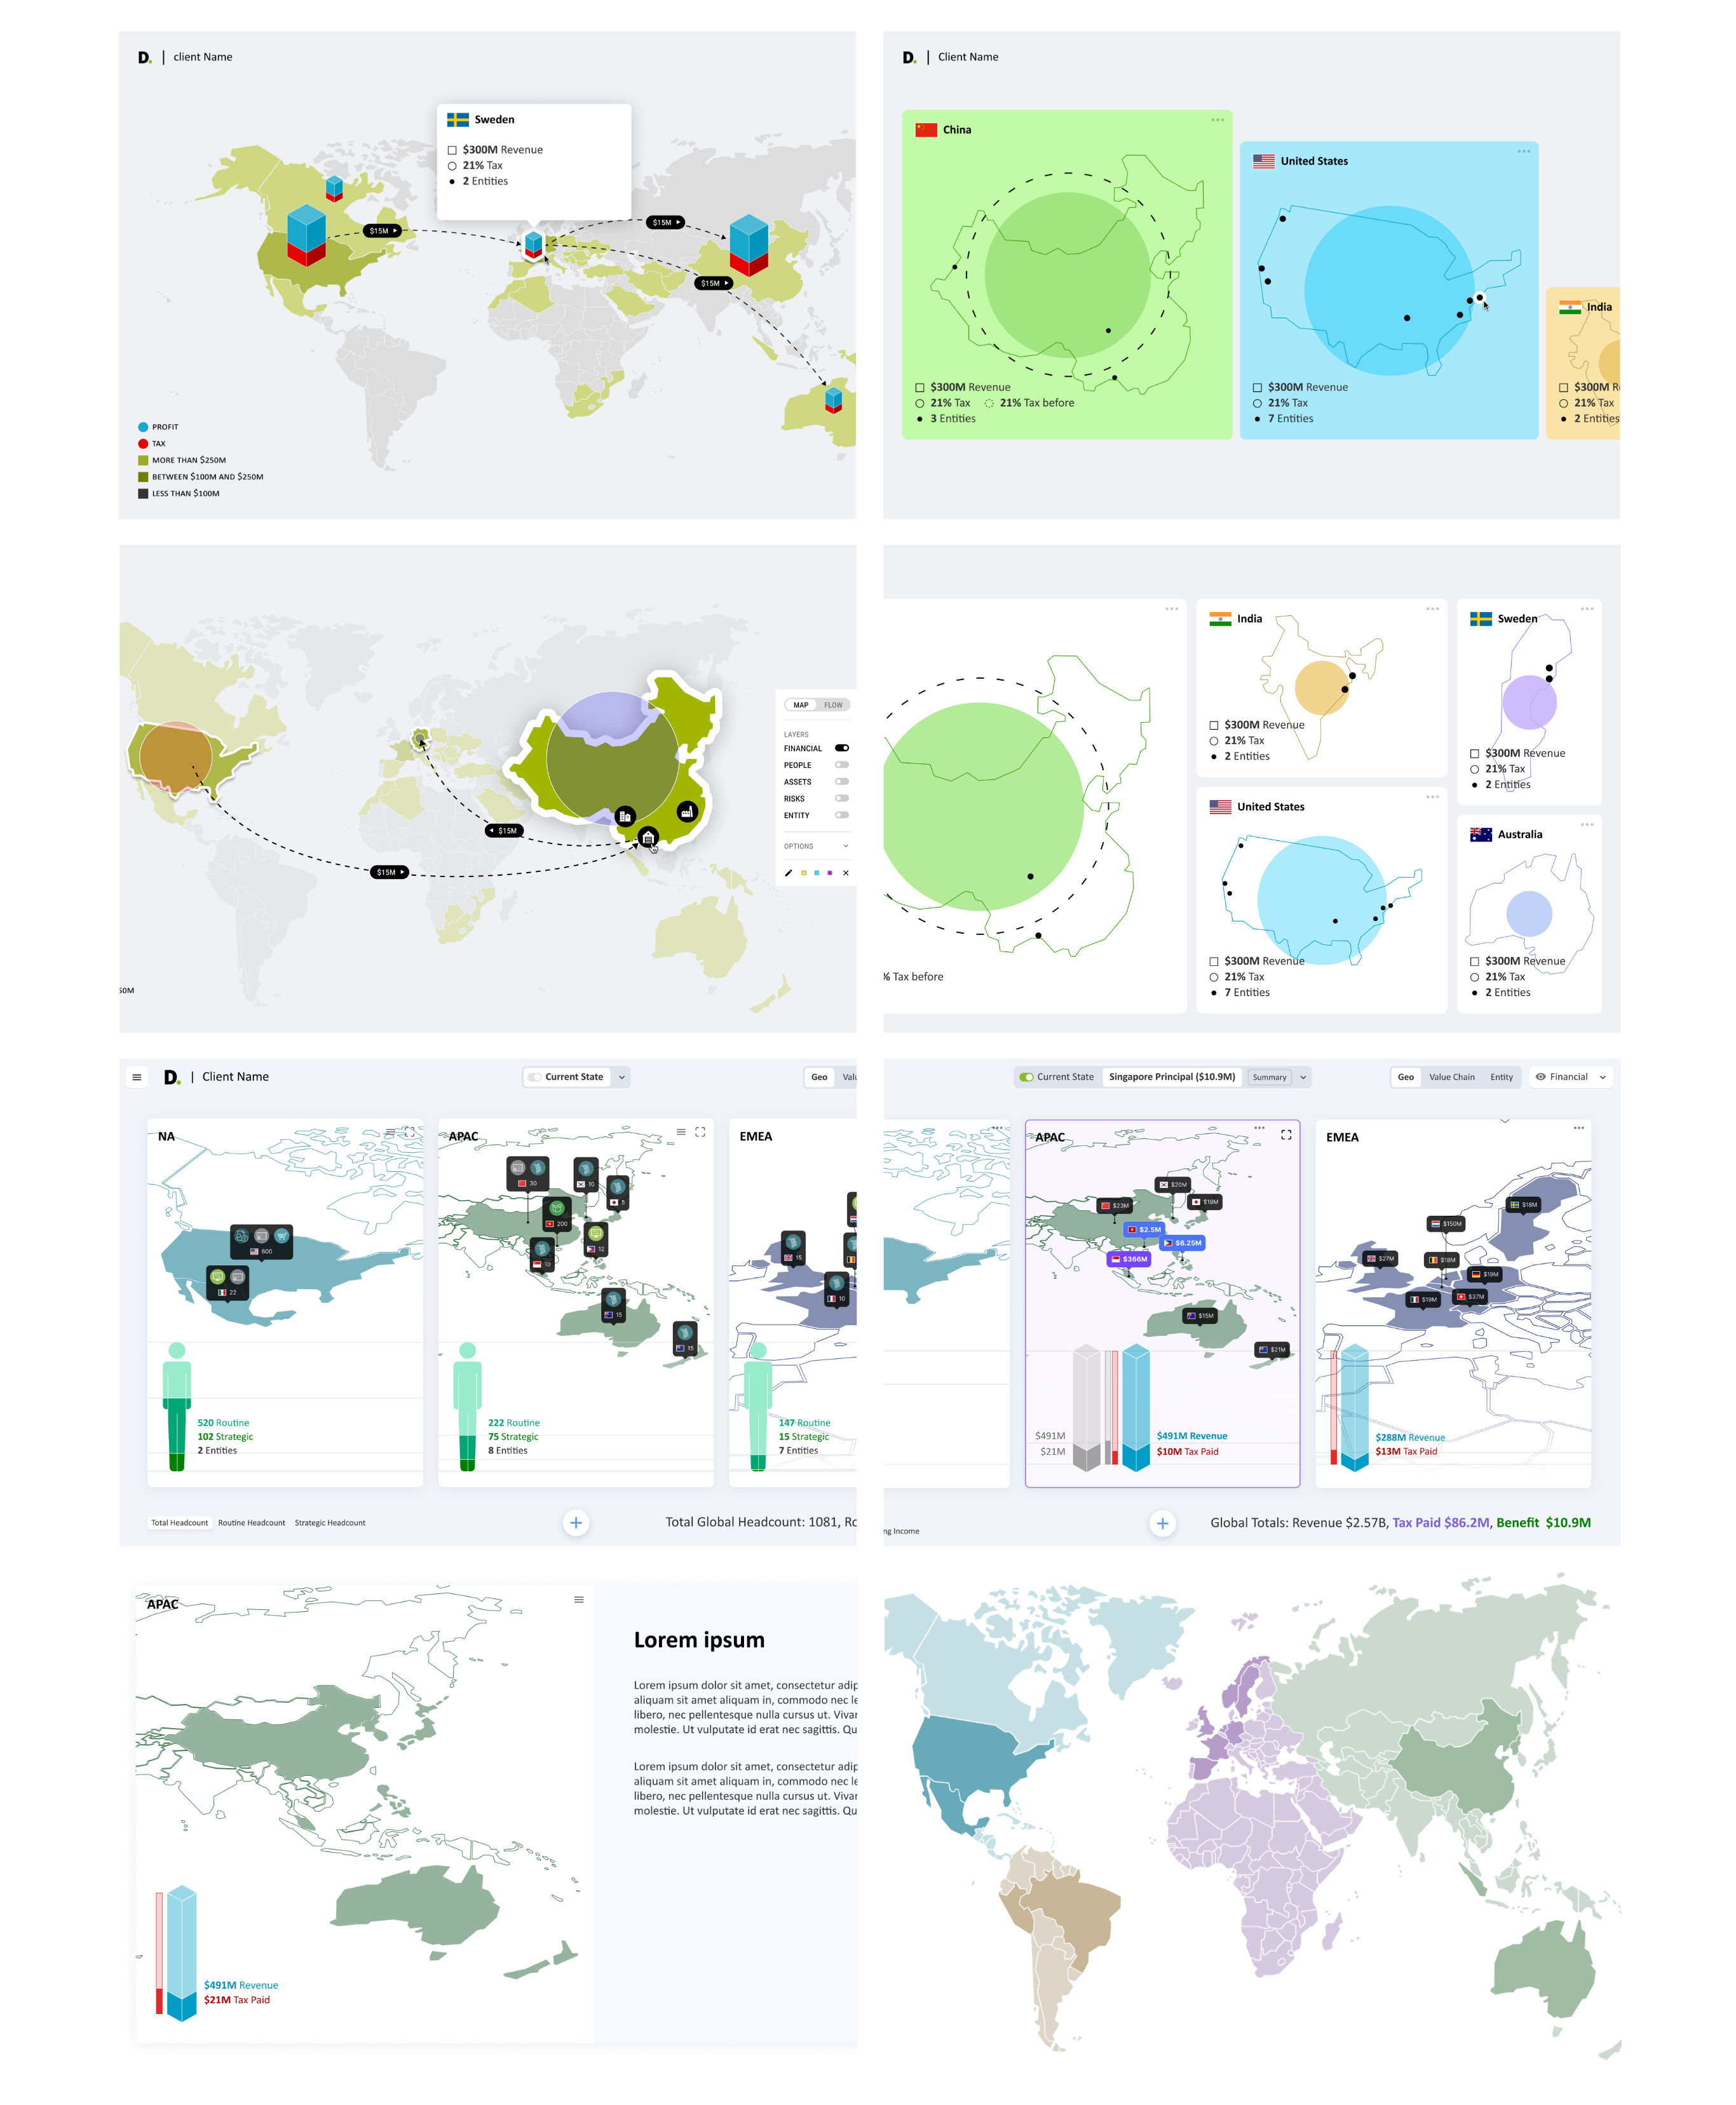
A robust data visualization platform for executives — built to make impact assessment fast, scenario comparison painless, and strategic decisions actually decisive.

Data visualization SWOT analysis User research Personas Wireframing Iterative design
My role
UX/UI designer
Partner
Kaizen Analytix
Users
Toyota executives
Output
Web platform

The brief

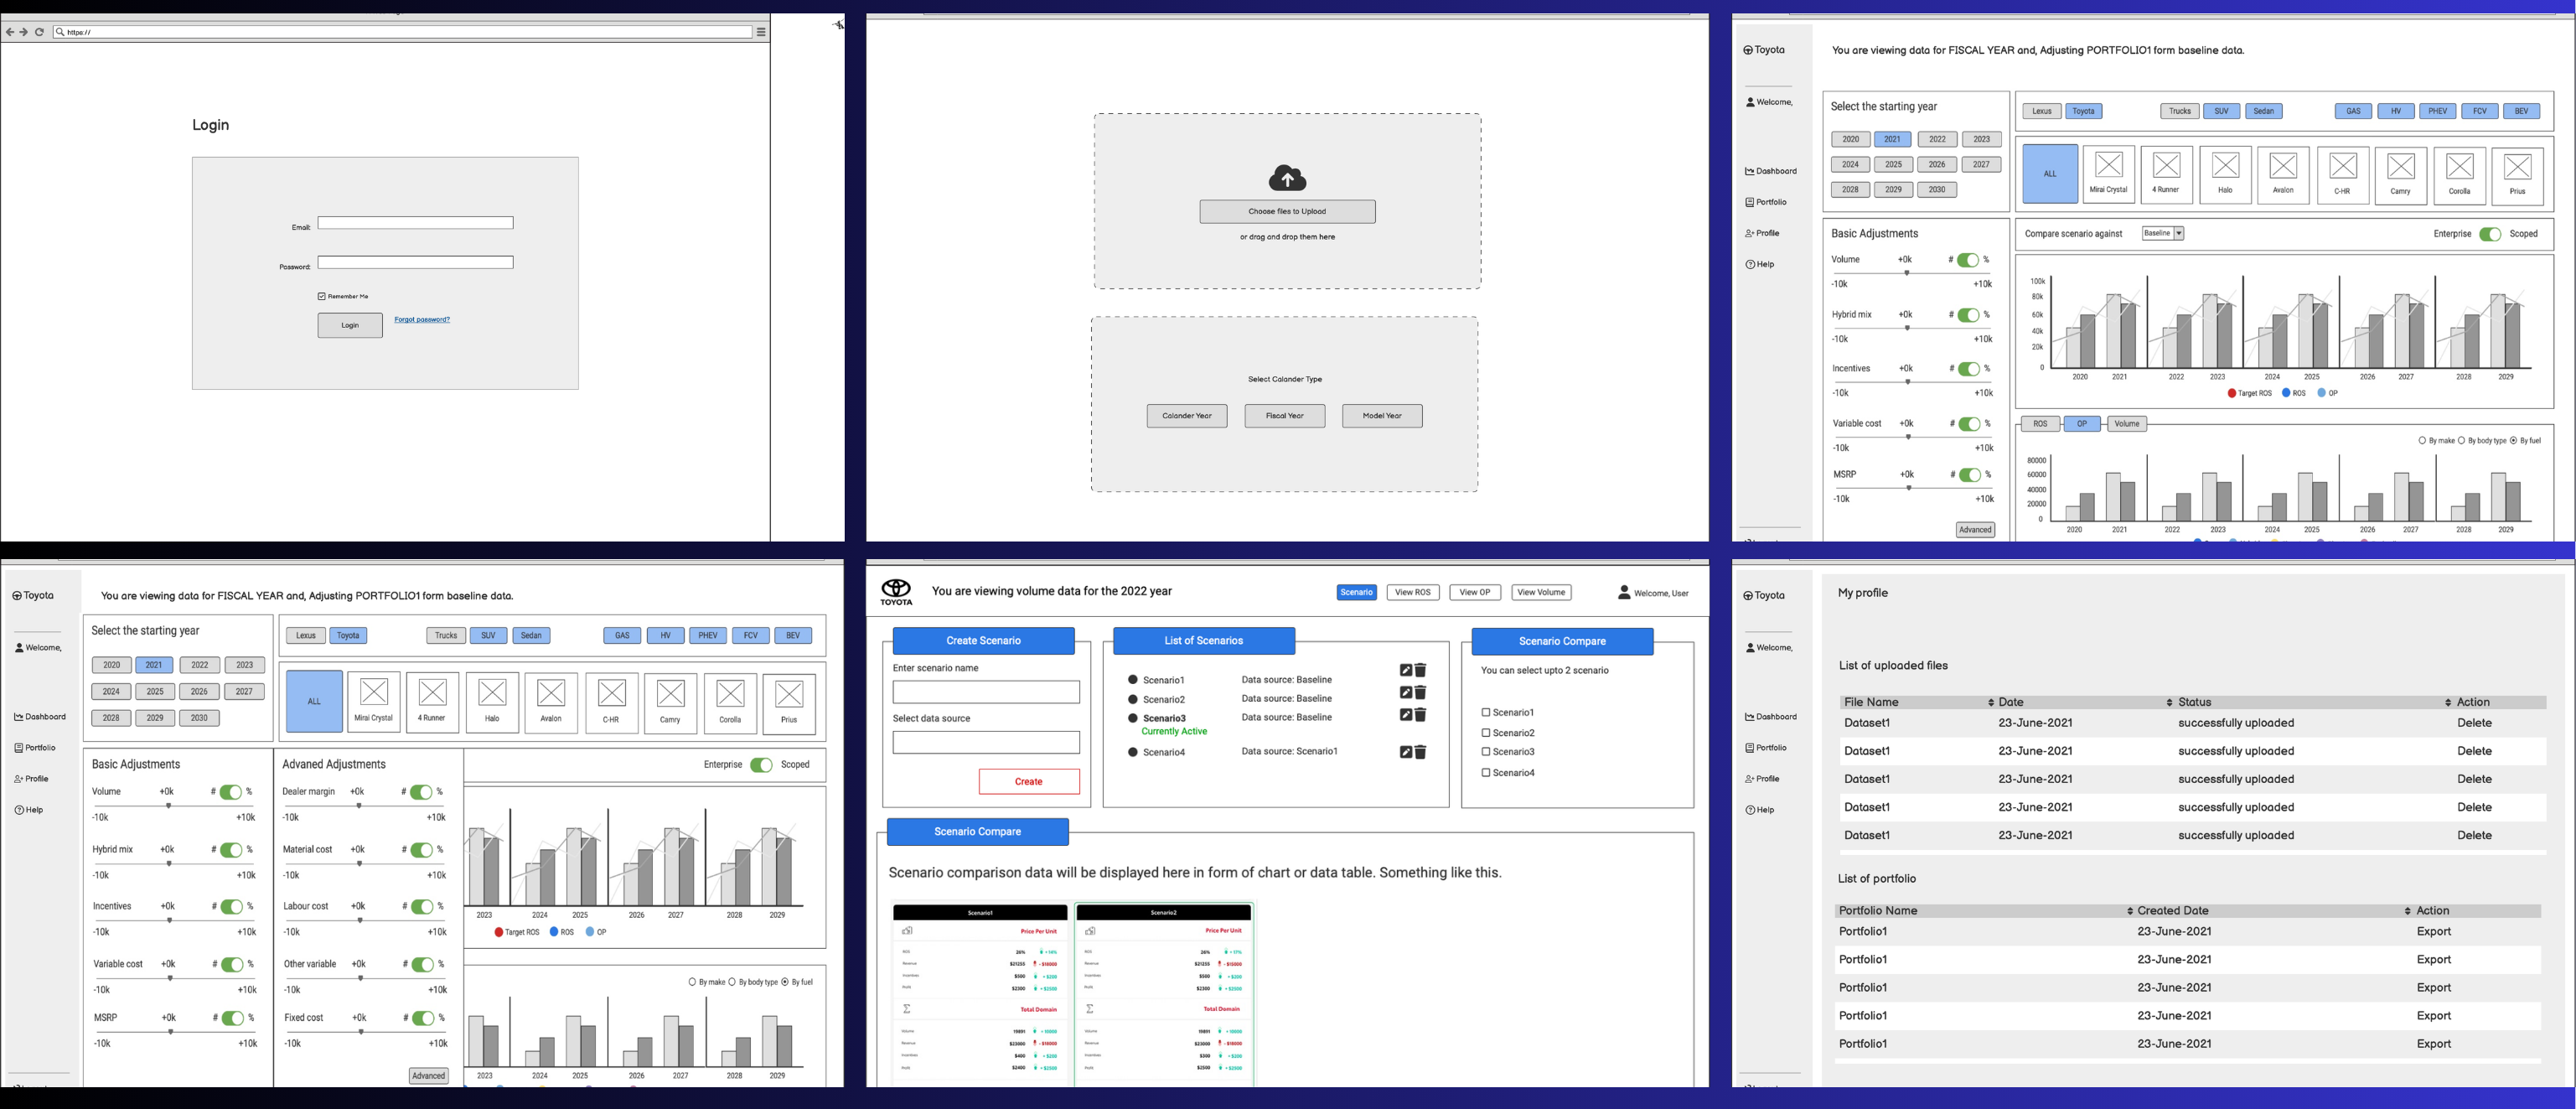
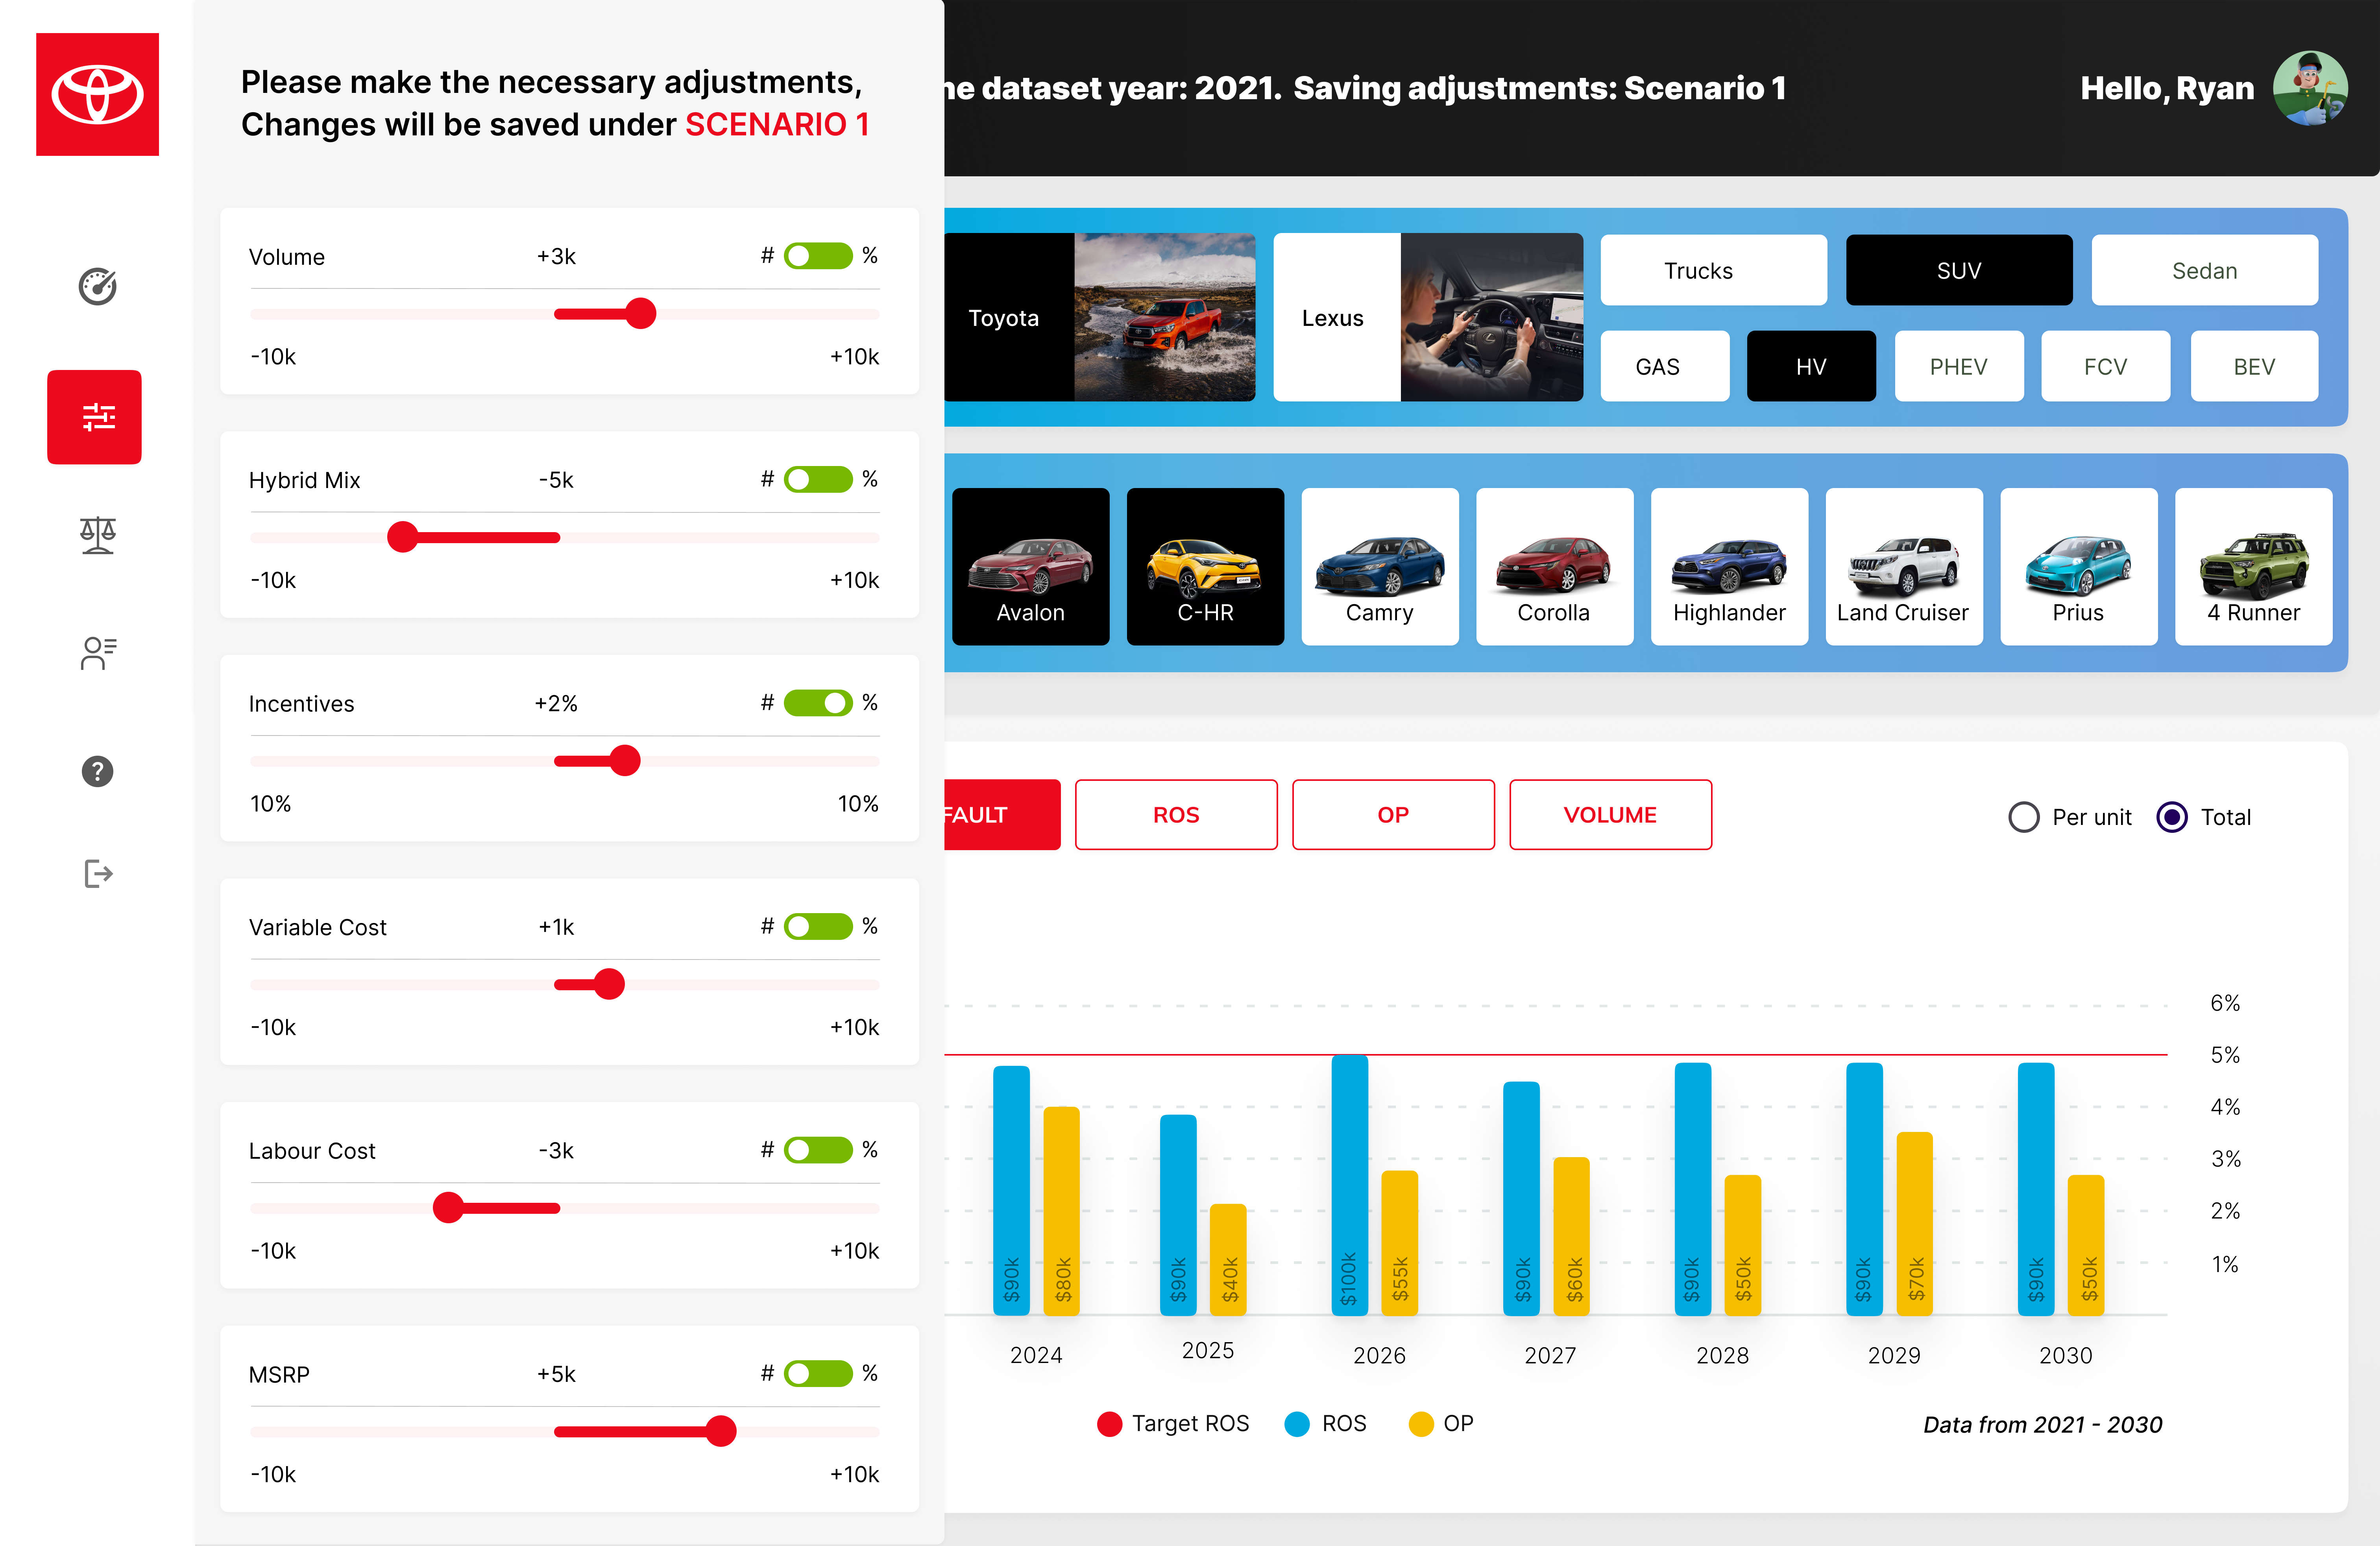
Toyota needed a custom platform that would let executives upload baseline data, adjust parameters dynamically, and compare multiple portfolios to evaluate different scenarios. Strategic decision-making, supported by a single tool instead of a stack of spreadsheets.

My role

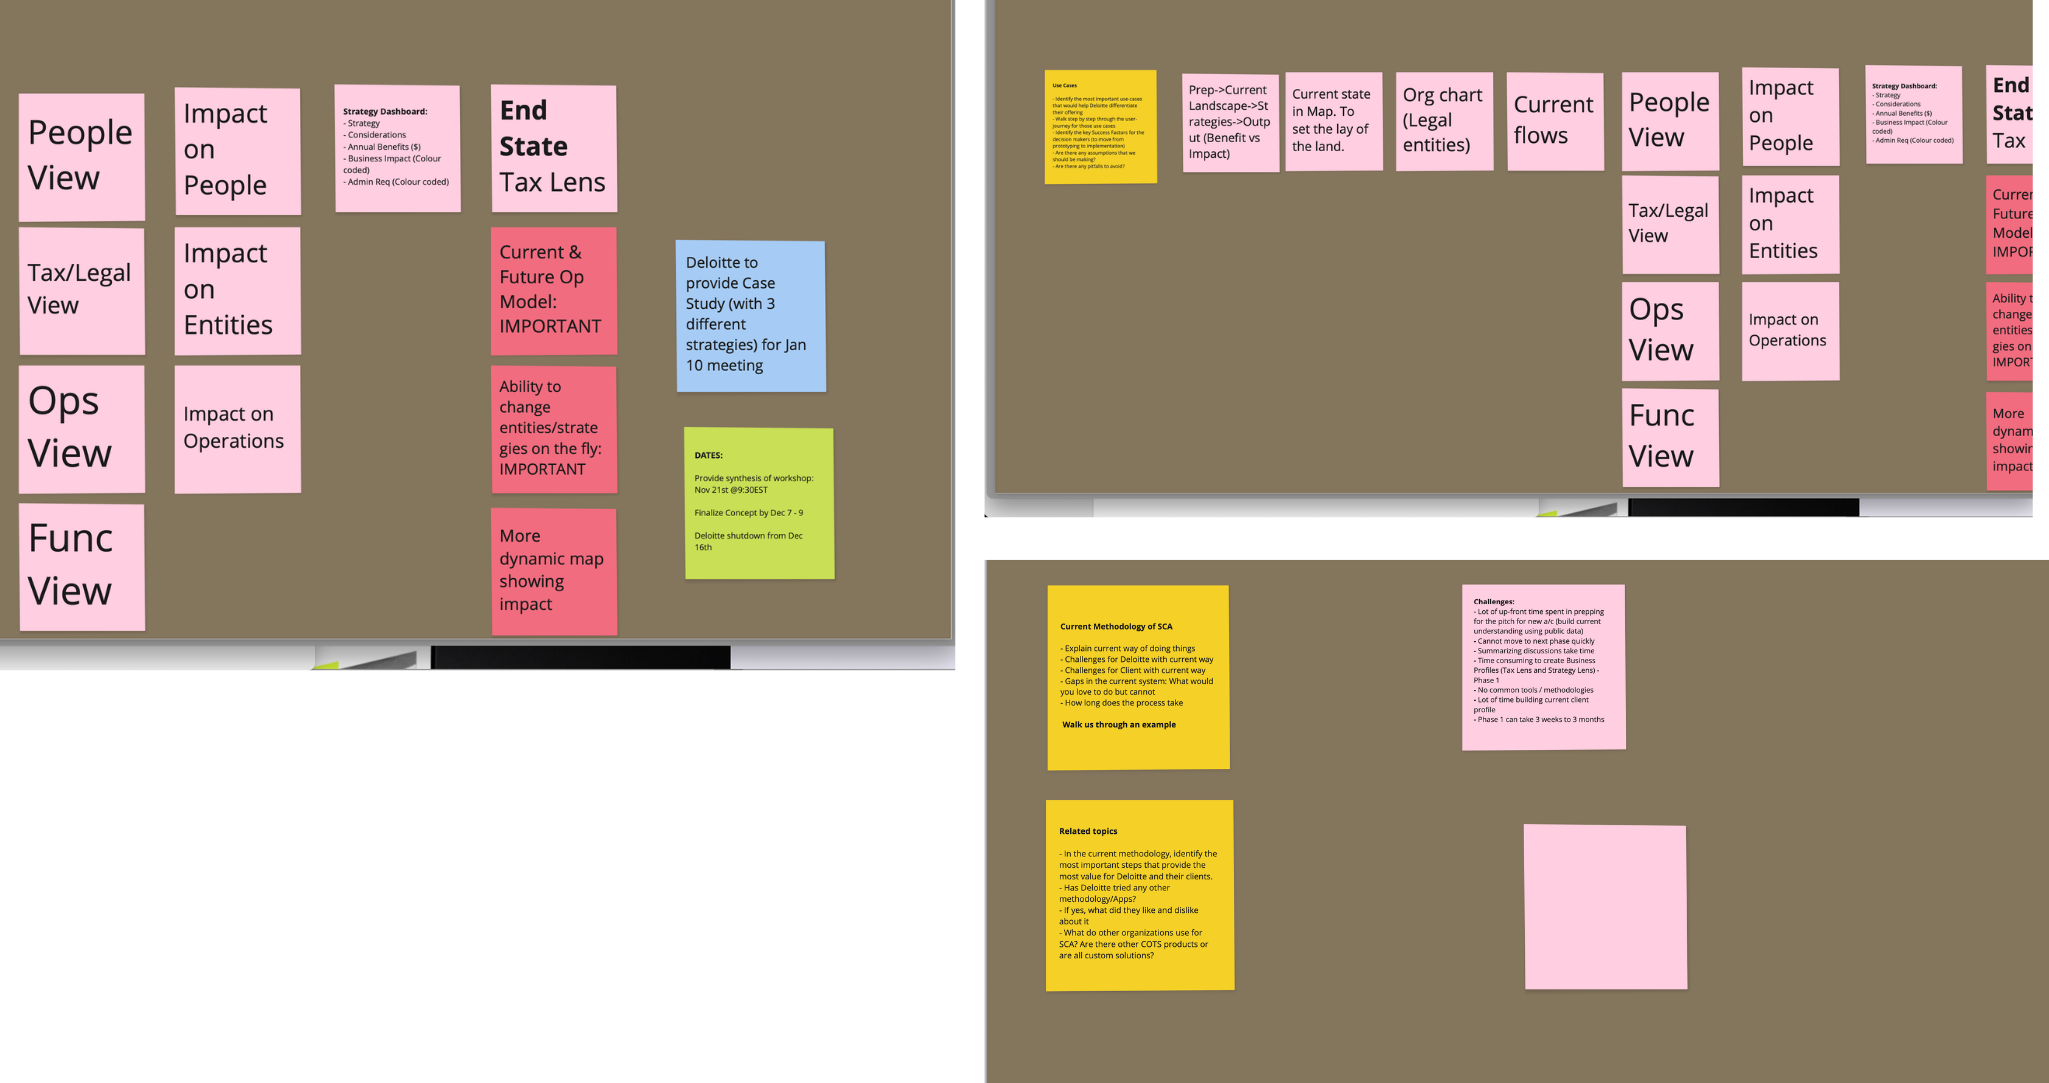
I gathered client requirements, collaborated on the design process, and facilitated iterative improvements. Workshops with Toyota framed the user needs. Working alongside Kaizen Analytix gave the data-side perspective. Developers were involved early to ensure technical feasibility from day one.

Research outputs

A comprehensive SWOT analysis shaped the strategic direction — leverage strengths (customization, user-centric design), exploit opportunities (predictive analytics), address weaknesses (manual data upload), mitigate threats (data security). From there: an action plan, application flow, and the Power User persona.
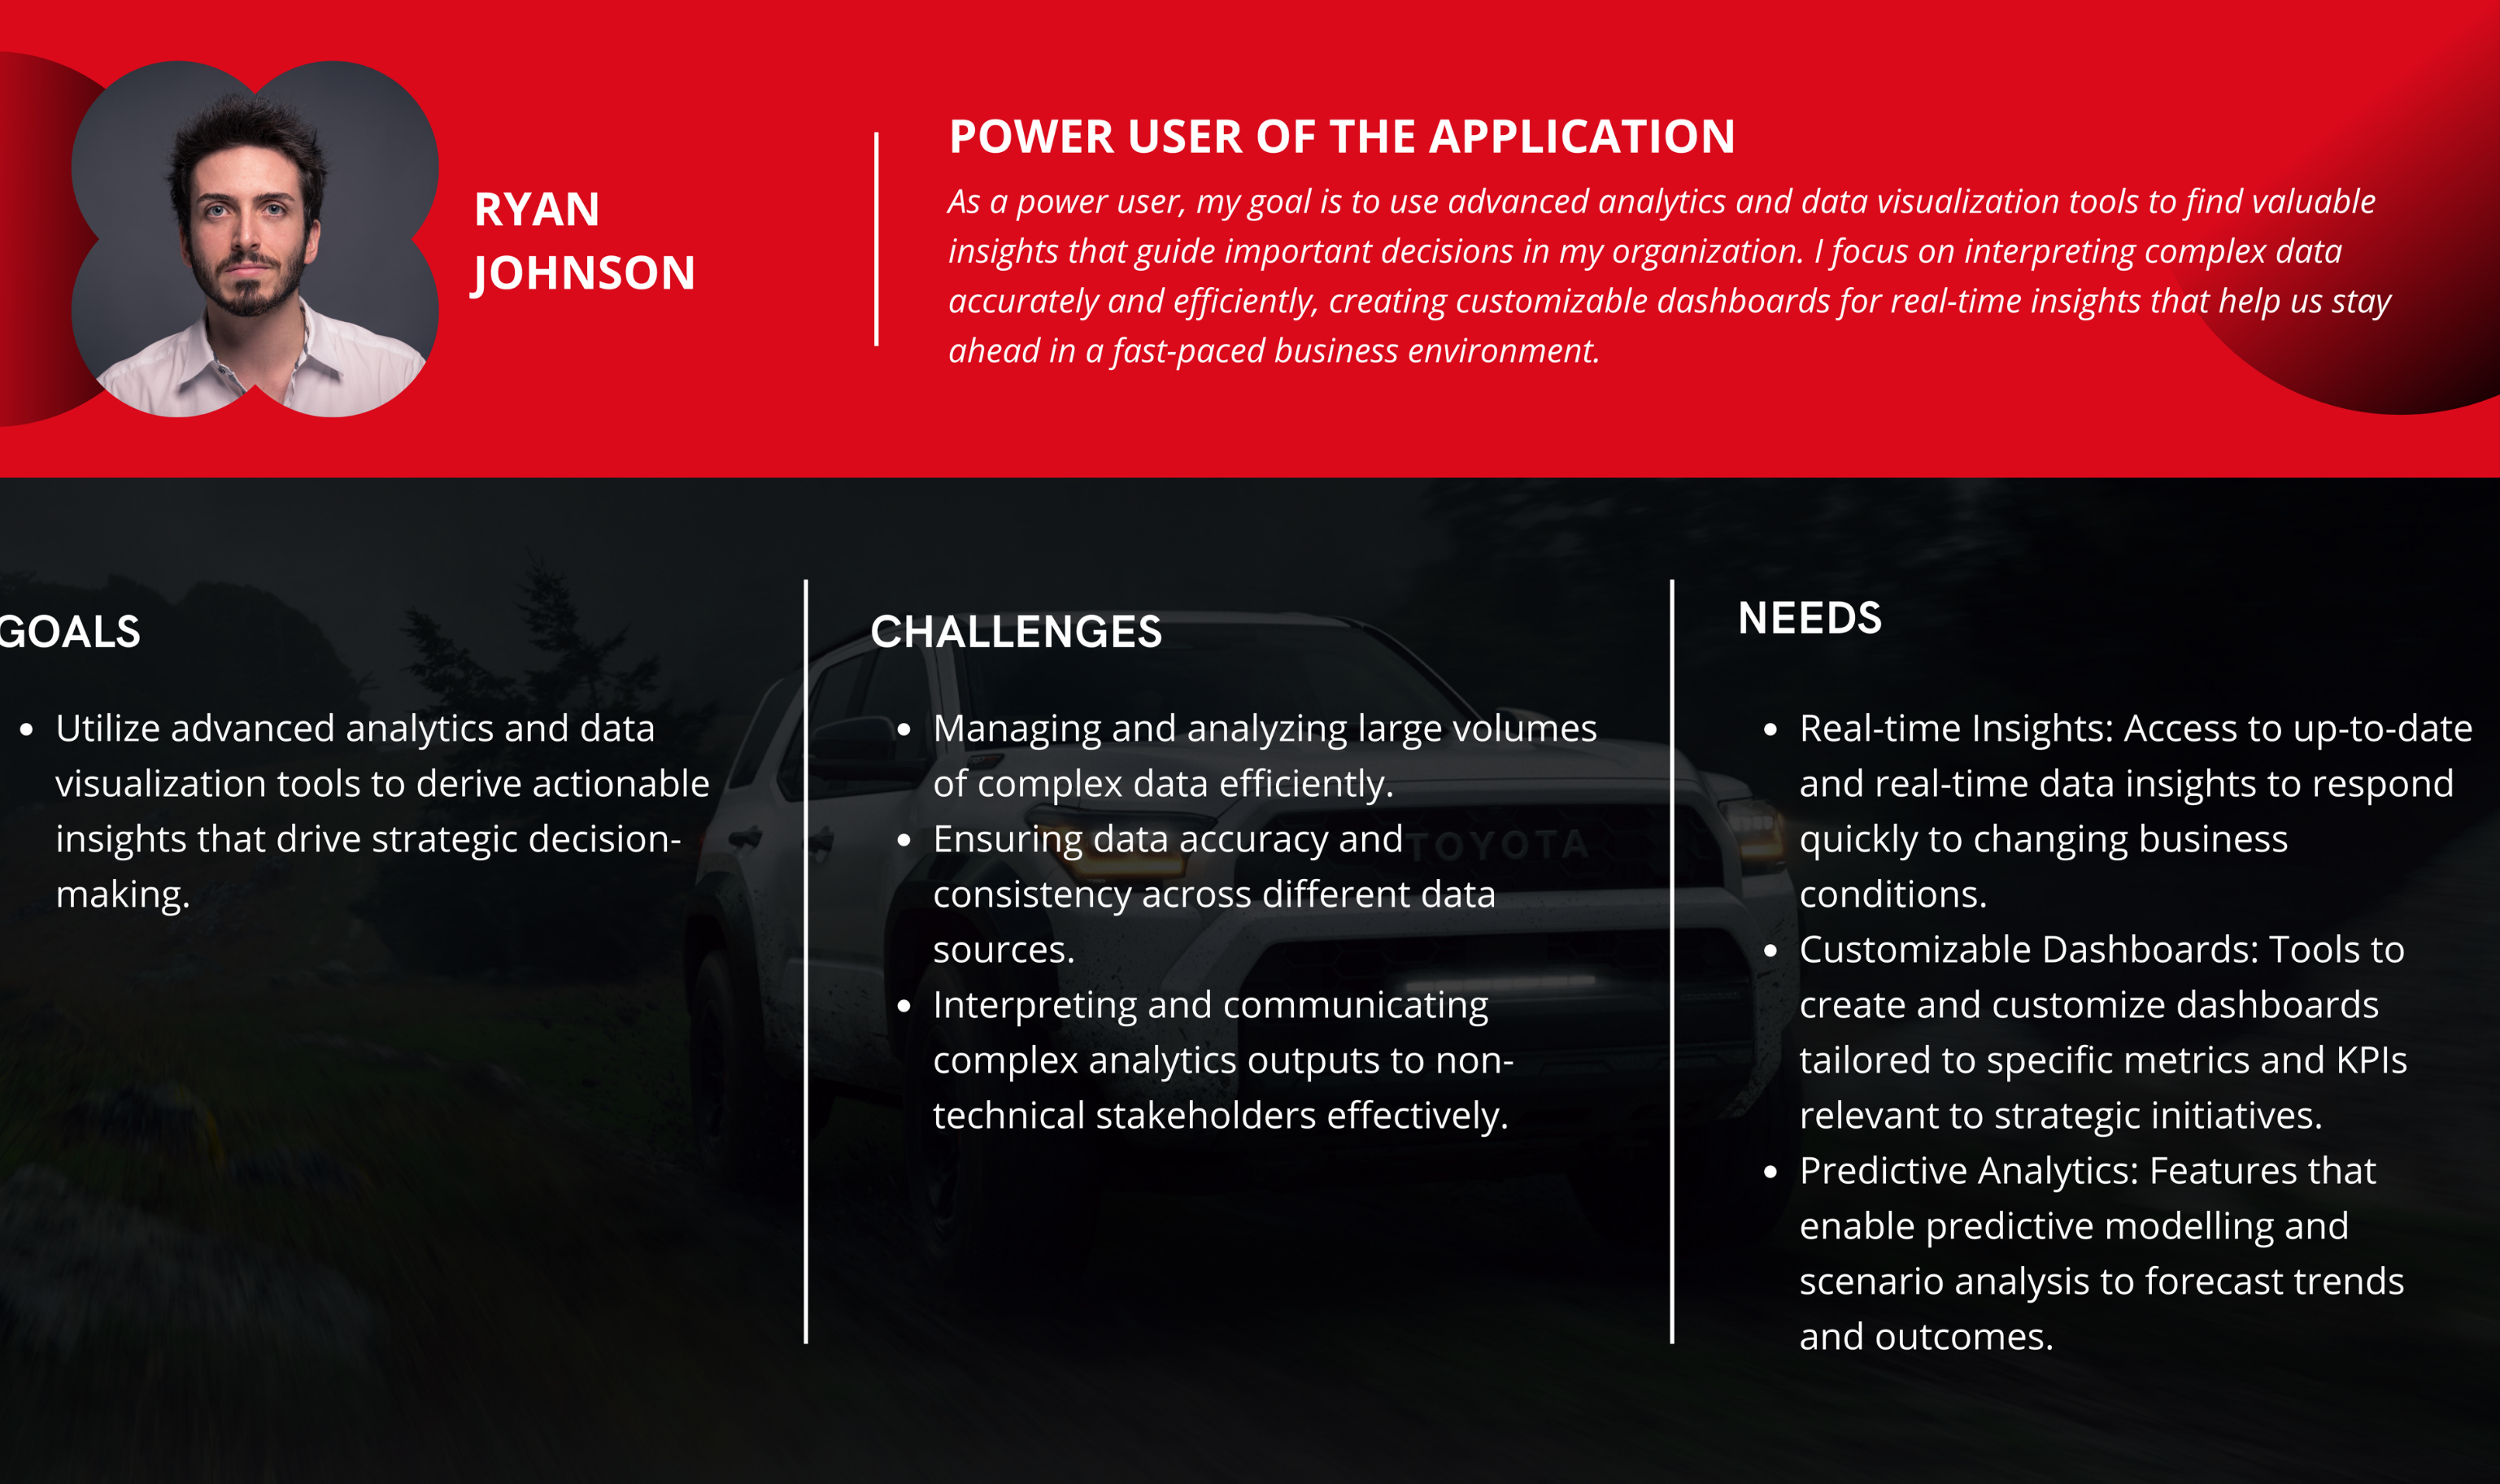
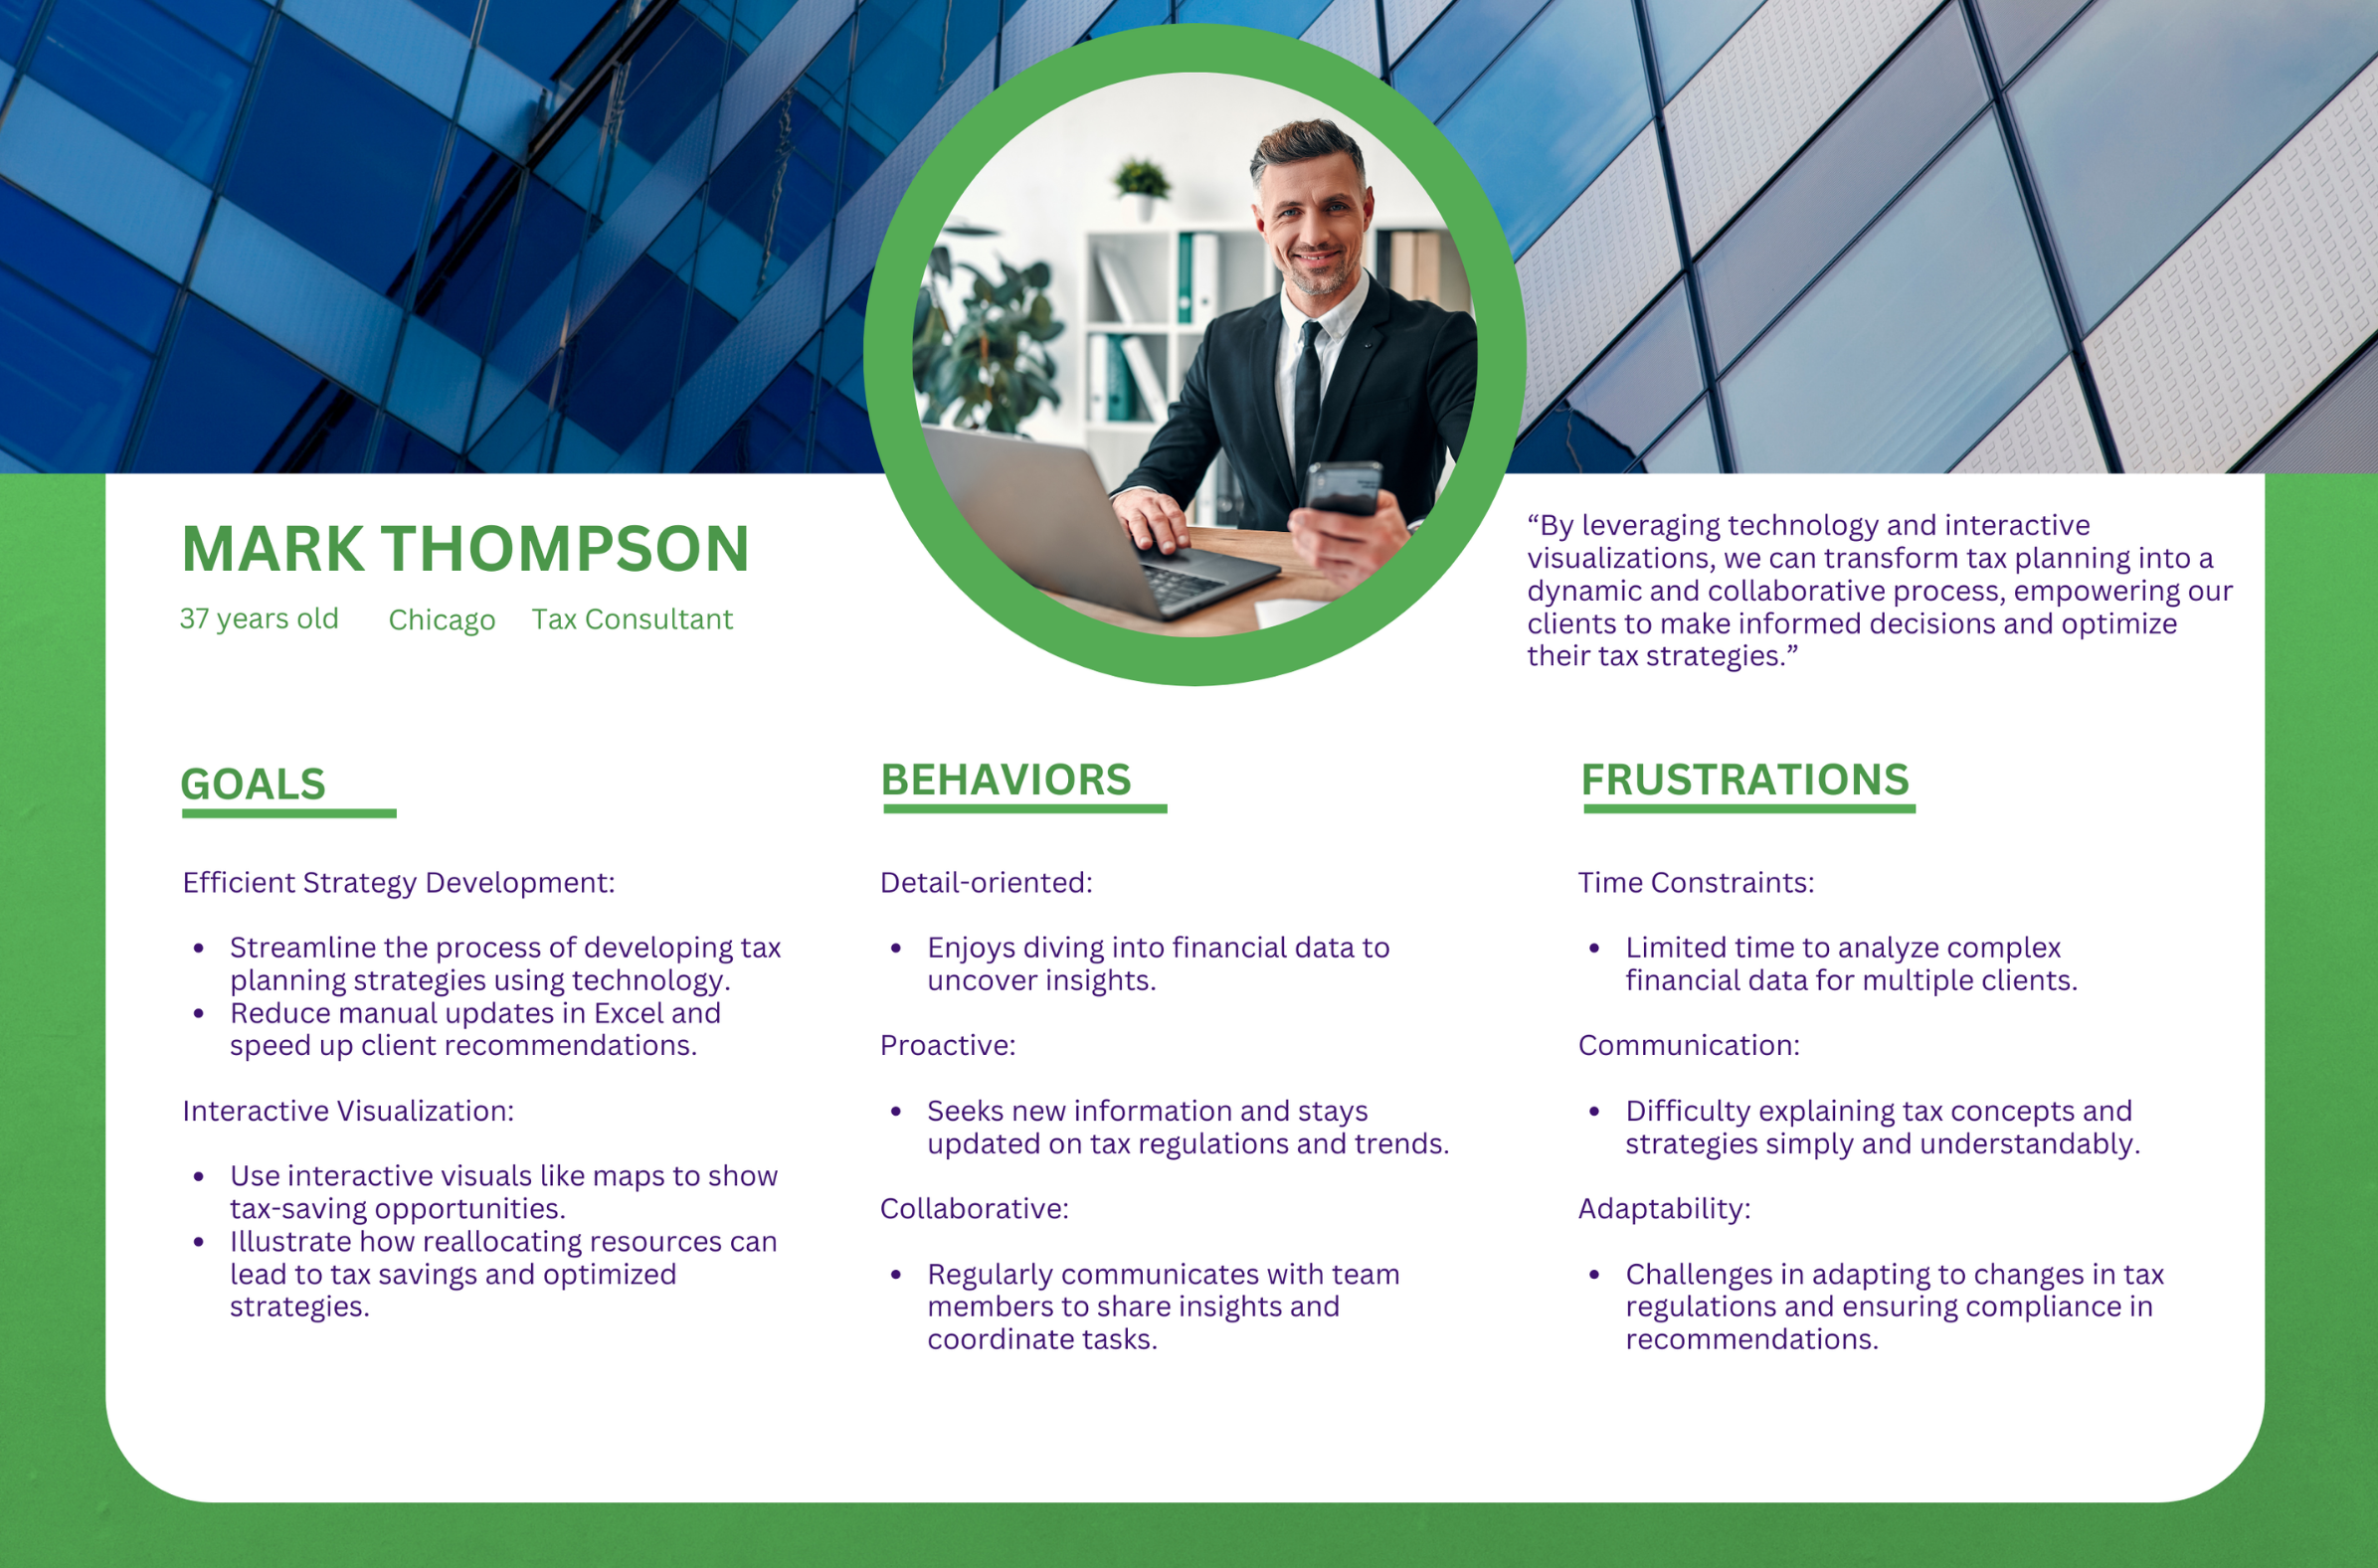
The persona

Ryan Johnson — Power User of the application. Goals: derive actionable insights, drive strategic decision-making. Challenges: managing complex data, communicating to non-technical stakeholders. Needs: real-time insights, customizable dashboards, predictive analytics.

Toyota Power User persona — Ryan Johnson, with goals, challenges, and needs
Power User persona.
01 / 03 — Research output
Toyota platform wireframes — login, data upload, calendar selection, advanced adjustments, scenario creation, profile management
Wireframes across the flow.
02 / 03 — Wireframes
Toyota Insights final dashboard — vehicle scenario comparison with target revenue and adjustments across years
Final dashboard — scenario comparison.
03 / 03 — Hi-fi mockup
03 — Project 02
Client Deloitte

VCA Platform — create the bigger picture together.

An internal web platform for Deloitte's Value Chain Analysis Sales Team — built to streamline tax strategy creation, replace PowerPoint and Excel, and let consultants adapt strategies live during client meetings.

Enterprise UX Workshop facilitation Personas Domain decoding Map-based UI Real-time strategy
My role
UX/UI designer
Research
Two full-day
Toronto workshops
Users
VCA Sales Team
tax consultants
Output
Internal web
platform

The brief

Deloitte's tax consultants were stuck in disjointed workflows — PowerPoint, Excel, and other tools to build strategies, with manual data movement causing errors and slow processes. The brief: a single platform that would let them create, visualize, and adjust tax strategies in real time, even mid-client-meeting.

My role

I led research workshops with Deloitte's Head of Delivery, Project Manager, and stakeholders during the discovery phase. Two full-day workshops in Toronto. Miro boards. Synthesized challenges, mapped solutions, and translated workshop output into design concepts that resonated with research outcomes.

Research outputs

The discovery phase produced six concrete outputs: objectives and goals, current challenges, application stages, tax information terminology, user types, and the Power-User persona. The terminology decoding alone — Session, Strategy, Lens, Entity, Transfer Pricing, Moving Functions — became the shared vocabulary the team designed against.

The user model

Three user types defined: Admin (manages accounts and configurations), Power User (runs sessions, performs value chain analysis, presents to clients), and Client User (read-only viewing). The platform was scoped around the Power User — represented by the persona Mark Thompson, a Chicago-based tax consultant.

Deloitte research workshop — Miro board with sticky-note clusters across People, Tax/Legal, Ops, and Func views
Research workshops.
01 / 03 — Discovery phase
Deloitte Power User persona — Mark Thompson, Tax Consultant, with goals, behaviors, and frustrations
Power User persona.
02 / 03 — Research output
Deloitte VCA Platform final designs — Hero Map View showing global tax flows, Entity drilldowns by country, regional Strategy Creation views
Hero Map View & Strategy Creation.
03 / 03 — Hi-fi designs
04 — What I took with me

Lessons from enterprise rooms.

i.

Workshops do the heavy lifting.

Two days in a room with stakeholders, sticky notes, and Miro boards saved months of guesswork. The clearer the discovery phase, the cleaner the design phase.

ii.

Decode the domain language.

Tax terminology. Vehicle scenarios. Value chains. You can't design for experts until you can speak their language. Glossary work isn't optional — it's a deliverable.

iii.

Engineers in the discovery room.

Both projects involved developers from the start, not after the designs were done. It's the only way to ship enterprise software that's both elegant and shippable.

Outcome

Two clients, two domains, one approach.

Research-led, workshop-driven, iterative. The kind of enterprise UX work that makes complex data feel like a decision the room is ready to make.

Other case studies
Healthcare dashboards.
Read case study